Global Trade in 2026: 10 Trends Reshaping Cross-Border Flows Amid Protectionism,

Lead Researcher
Layla Al-Mansoori
After a record-breaking 2025, global trade is entering a slower, more fragmented
Global Trade in 2026: 10 Trends Reshaping Cross-Border Flows Amid Protectionism, Digital Shifts, and Green Policies
After reaching a record $35 trillion in 2025, global trade is entering a slower, more fragmented phase. The post-pandemic rebound is fading, replaced by a landscape where tariff barriers, geopolitical blocs, and climate regulations are redrawing the map of cross-border commerce. Drawing on recent UNCTAD and WTO data, this article unpacks ten key trends that will define trade in 2026 — from the surge in South-South flows to the start of Europe’s carbon border tax — and examines what these shifts mean for developing economies.
The Macro Landscape: Slowing Growth and Rising Protectionism
Global merchandise trade hit an all-time high in 2025, but the momentum is cooling. The IMF projects world GDP growth will decelerate to 2.6% in 2026, dragged down by weaker expansion in the United States and China. Trade volumes, which grew roughly 3.5% last year, are expected to slow as inventory cycles normalize and consumer demand softens in advanced economies. The World Trade Organization has already flagged that trade tensions — including new U.S. tariffs on Chinese EVs and semiconductors, and retaliatory measures from Beijing — are injecting uncertainty into supply chain planning.
For developing economies outside China, the picture is more challenging. Growth is forecast to slip to 4.2%, still robust but insufficient to close income gaps rapidly. Higher borrowing costs, currency depreciation, and reduced capital inflows are squeezing the fiscal space needed to invest in trade-enabling infrastructure. Meanwhile, protectionism is on the rise: the number of trade-restrictive measures implemented by G20 economies in 2025 was the highest in a decade, according to the WTO’s latest monitoring report. This backdrop casts a long shadow over the WTO’s 14th Ministerial Conference scheduled for Yaoundé, Cameroon, in early 2026. Negotiations on fisheries subsidies, digital trade rules, and agricultural reform are expected to face stiff headwinds.
[IMAGE: World map with temperature-like gradient showing GDP growth rates by country in 2026, with red-hot tariff zones (icons of trade barriers) in the US, EU, and parts of Asia, and cooler blues in Sub-Saharan Africa and South Asia.]
Services Trade Surge and the Digital Divide
One of the most striking structural shifts is the rapid expansion of services trade. Services now account for 27% of global trade and grew 9% in 2025, outpacing goods growth of just 2%. Digitally deliverable services — including cloud computing, streaming, software licensing, and online education — represent 56% of all services exports, up from 45% a decade ago. This trend is reshaping global value chains: manufacturing firms increasingly embed services such as design, logistics, and after-sales support into their product offerings, making service inputs a critical determinant of competitiveness.
Yet the benefits are highly uneven. Least developed countries (LDCs) derive only 16% of their services exports from digital channels, compared to over 60% for developed economies. The digital divide is not just about access to broadband; it reflects gaps in digital payment systems, cybersecurity, data regulation, and the availability of skilled tech labor. As global value chains become more service-intensive, LDCs risk being marginalized unless they accelerate investment in digital infrastructure and regulatory reforms.
There is, however, a window of opportunity. International development agencies and private investors are pouring resources into subsea cable projects in Africa, satellite-based internet in Asia, and mobile money platforms in the Pacific. If these investments scale up, LDCs could leapfrog into high-value digital services — from telemedicine to digital content production — that bypass traditional barriers like poor roads and ports.
[IMAGE: Bar chart comparing the share of digitally deliverable services in total services exports: developed economies (e.g., EU, US, Japan) at 62%, developing economies at 38%, and LDCs at 16%, with a digital cable icon bridging the gap between the latter two.]
The Rise of South-South Trade: A New Engine
Perhaps the most profound geographical shift is the deepening of trade among developing economies. South-South merchandise exports have soared from $0.5 trillion in 1995 to $6.8 trillion in 2025 — a more than tenfold increase in three decades. Today, 57% of all exports from developing countries go to other developing economies, compared to just 30% in 1995. This trend is driven primarily by intra-Asian value chains, where China, India, and Southeast Asian economies trade intermediate goods — electronics, auto parts, machinery — in massive volumes.
Africa exemplifies the shift. More than half of the continent’s exports now head to other developing nations, with China, India, and the UAE becoming dominant partners. The African Continental Free Trade Area (AfCFTA), though still in early implementation, has the potential to accelerate intra-African trade by reducing tariffs and harmonizing standards. For Latin America, South-South trade has been bolstered by agricultural exports to Asia and regional value chains in automobiles and food processing.
This structural transformation reduces reliance on traditional North-South corridors and creates new centers of gravity for supply chains. But it also brings risks: developing economies are increasingly exposed to each other’s economic cycles, policy instability, and infrastructure bottlenecks. Diversification across both South-South and North-South routes remains a prudent strategy.
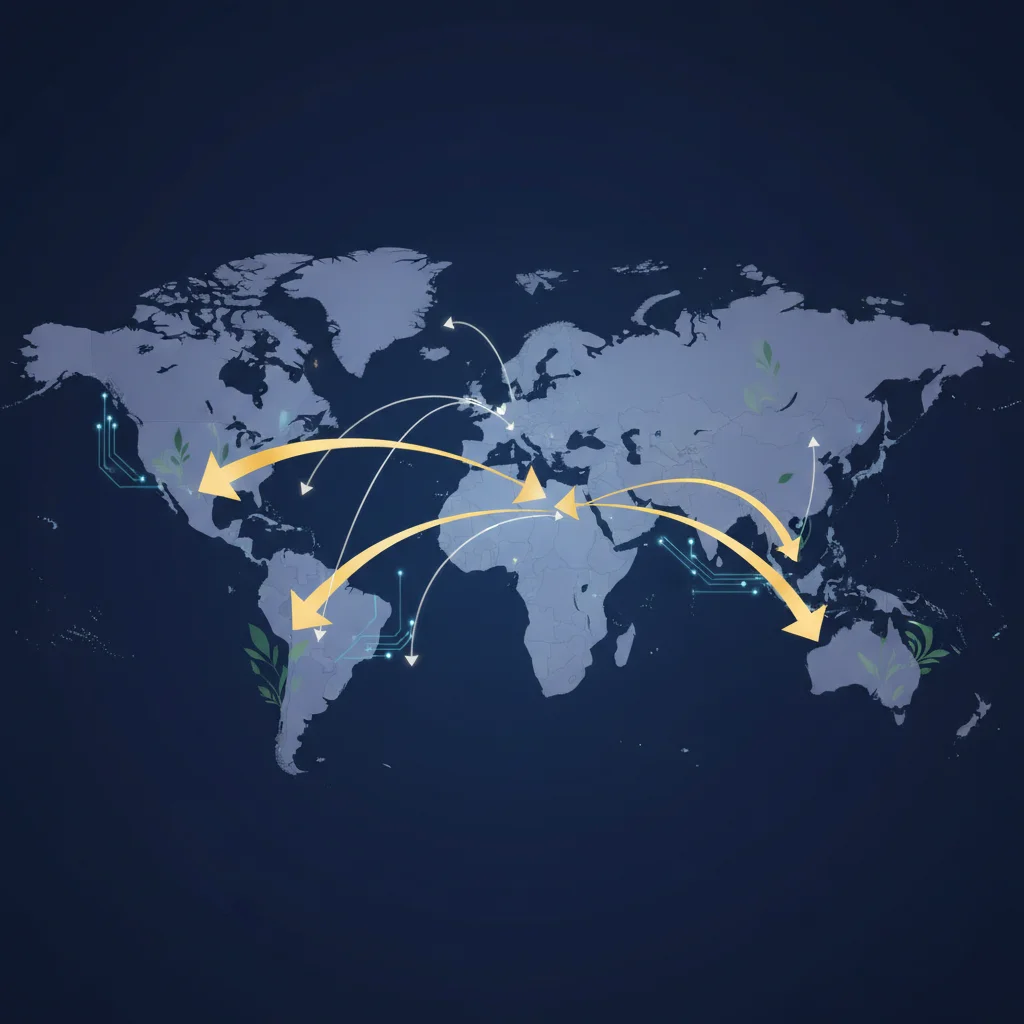
[IMAGE: Flow lines comparing South-South trade volume in 1995 (thin gold lines) vs 2025 (thick gold lines) between three regions: Africa, Asia, and Latin America, with a side comparison to North-South flows (silver lines) that have grown much less.]
Environmental Policies Reshaping Trade Competitiveness
The intersection of trade and climate policy is entering a new phase of enforcement. The European Union’s Carbon Border Adjustment Mechanism (CBAM) begins its transitional reporting phase in 2026, requiring importers of iron, steel, aluminum, cement, fertilizers, hydrogen, and electricity to declare the embedded emissions in their products. Full financial obligations — effectively a carbon tariff — will follow in 2027. This mechanism is designed to prevent “carbon leakage” and protect EU industries that face high carbon compliance costs. But for developing-country exporters, it introduces complex compliance costs and the risk of being locked out of the EU market if they lack emissions monitoring systems.
Meanwhile, 113 countries have submitted enhanced Nationally Determined Contributions (NDCs) that, if fully implemented, could cut global emissions by 12% by 2035. These pledges are driving investment in clean energy technologies — solar panels, wind turbines, battery storage, and electrolyzers — with the global market for such goods projected to reach $640 billion annually by 2030. Countries that can produce clean energy inputs cheaply — such as Chile with solar, Indonesia with nickel, or Morocco with green hydrogen — stand to gain a competitive edge.
Conversely, nations heavily dependent on fossil fuel exports face a double hit: falling demand and potential carbon border taxes. Critical minerals — lithium, cobalt, rare earths, and copper — have seen price swings of 30–50% over the past two years, driven by supply concentration and demand shocks from the clean energy transition. For mineral-rich developing economies, this volatility creates both opportunity and risk; export revenues can boom but also bust if new supply sources (e.g., deep-sea mining, recycling) come online faster than expected.
Food security also intersects with trade and climate. Extreme weather events in 2024–25 damaged harvests in major grain-producing regions, causing temporary export bans and price spikes. The trend toward agricultural protectionism — with 25% of food products now subject to some form of restriction — raises concerns that climate shocks could exacerbate food insecurity in importing nations. Trade policy must evolve to ensure that environmental measures do not become disguised barriers that hurt the most vulnerable.
[IMAGE: Split image: left side industrial smokestacks with a carbon price tag symbol overlaid; right side wind turbines and solar panels with a graph showing projected clean-energy technology market growth from 2024 to 2030, rising from $400bn to $640bn.]
Navigating a Fragmented Future
The ten trends shaping global trade in 2026 — from the services surge and South-South realignment to carbon regulation and digital exclusion — do not point in a single direction. Instead, they paint a picture of fragmentation and divergence. Some economies will ride the wave of digitalization and clean energy, while others risk falling into a trap of commodity dependence and tariff isolation.
For developing economies, the stakes are high. Success will depend on strategic investments in digital infrastructure, emissions monitoring, and regional integration. Multilateral forums like the WTO Yaoundé conference offer a rare opportunity to update trade rules for the 21st century — covering data flows, environmental subsidies, and digital taxation. But with protectionism rising and geopolitical trust eroding, progress will likely be incremental at best.
What is clear is that the old map of global trade — with goods flowing from low-cost factories in East Asia to wealthy consumers in the West — is being redrawn. The new map has multiple nodes: service hubs in India, manufacturing corridors in Latin America, green energy corridors across North Africa and Europe, and agricultural supply chains stretching across the global South. Navigating this fragmented terrain requires agility, data literacy, and a willingness to embrace both competition and cooperation. The countries that master these shifts will not just survive the slowdown of 2026 — they will define the architecture of trade for the decade to come.